Posts

Adobe: $4.62 or $6.13 EPS? Read the Reconciliation
Image
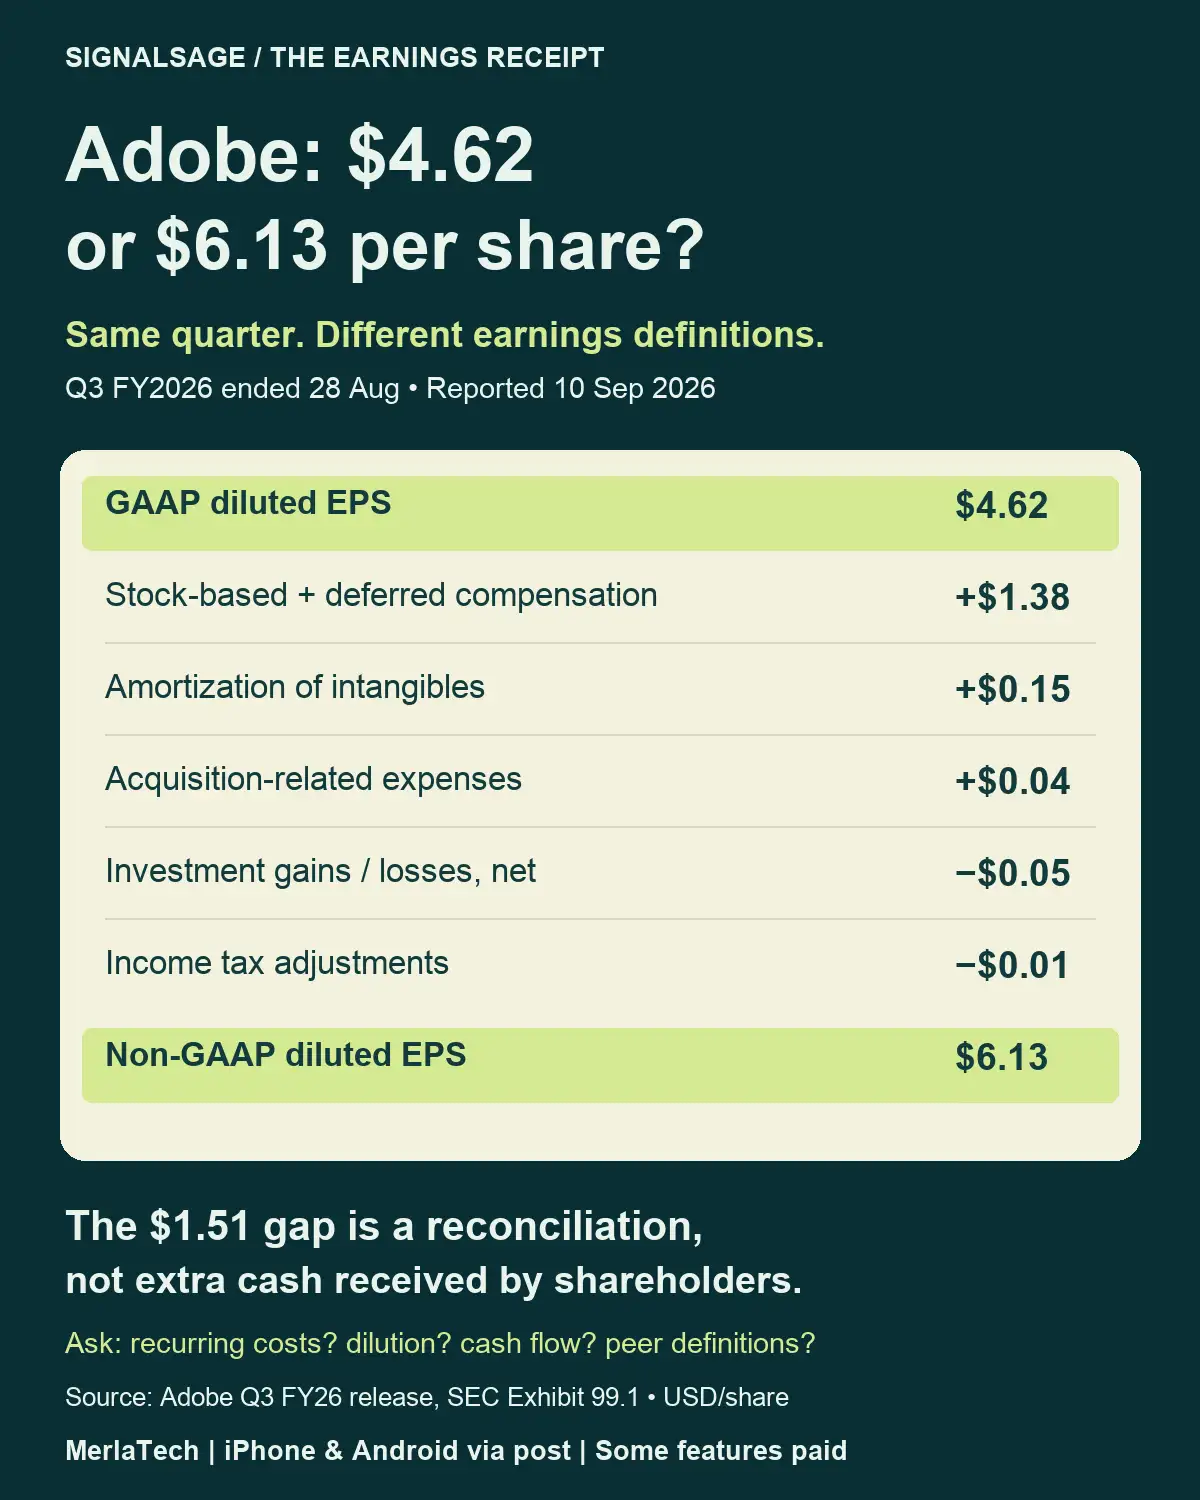
Adobe: $4.62 or $6.13 EPS? Read the Reconciliation Adobe reported Q3 FY2026 diluted EPS of $4.62 under GAAP and $6.13 on its non-GAAP basis. The quarter ended 28 August; the release was dated 10 September 2026. The per-share bridge is $4.62 + $1.38 stock-based/deferred compensation + $0.15 intangible amortization + $0.04 acquisition expenses − $0.05 investment gains/losses − $0.01 tax adjustments = $6.13. Figures are rounded as reported. The $1.51 gap is not extra cash paid to shareholders. Ask which excluded costs recur, how equity compensation affects dilution, what the cash-flow statement shows, and whether peer definitions match. Neither EPS measure alone establishes valuation or future returns. Source: Adobe SEC earnings release, 10 September 2026 SignalSage by the MerlaTech team — US stock research. English UI; some features require in-app purchases/subscriptions. Education, not investment advice. iPhone & Android: iPhone and Android download page Start with a definition befo...
TSMC August Revenue: Why +10.1% and +53.3% Can Both Be Right

Image
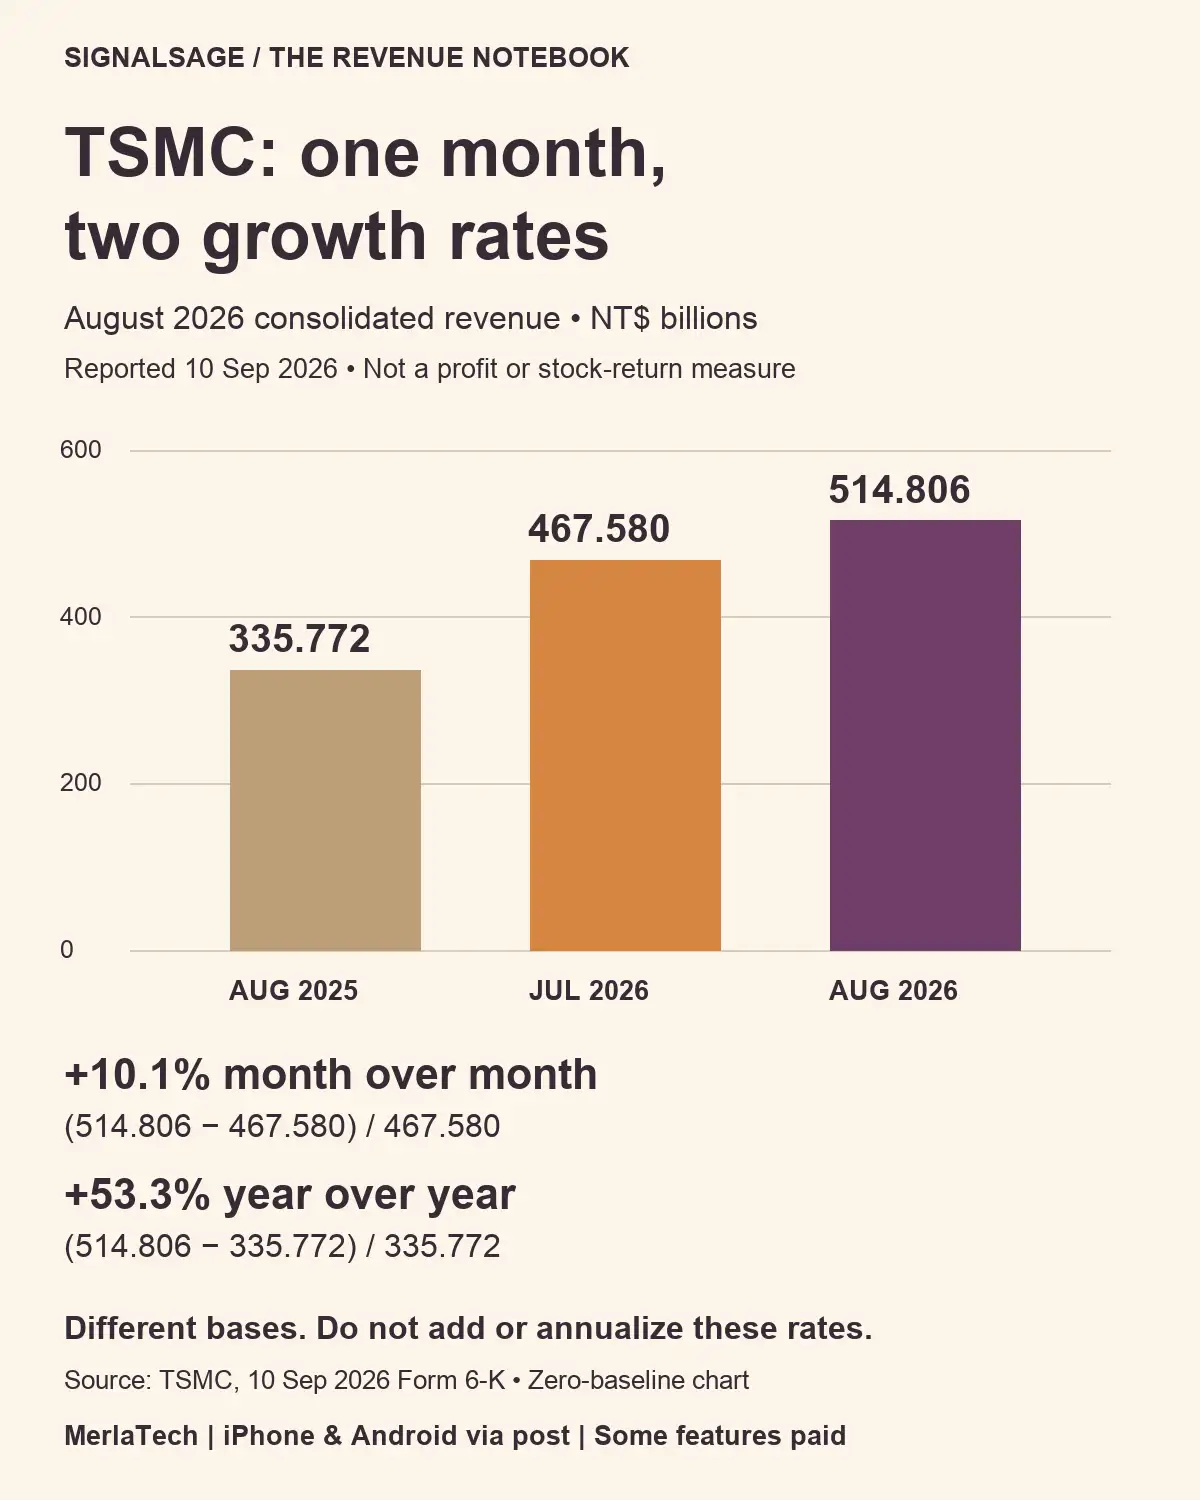
TSMC reported August 2026 consolidated revenue of NT$514.806 billion in its 10 September release. July 2026 was NT$467.580 billion; August 2025 was NT$335.772 billion. These are reported revenue figures, not profit or stock returns. The month-over-month comparison adds NT$47.226 billion: 47.226 / 467.580 = about 10.1%. The year-over-year comparison adds NT$179.034 billion: 179.034 / 335.772 = about 53.3%. Both percentages describe the same August total, using different starting points. Do not add the two rates, subtract them to infer acceleration, or treat one month's growth as an annual forecast. Compare matching periods and currencies, then read margins, cash flow and the business mix separately. Save a three-field research note: reported period, comparison period, currency/unit. A growth percentage without its baseline is an incomplete fact. Start with the unit before doing any arithmetic. The release’s table uses NT$ millions. Dividing every amount by 1,000 produces the NT$...

Samsung + Mistral: When AI Flags a Defect, How Often Is It Right?

Image
Samsung + Mistral: when AI flags a chip defect, how often is it right? Samsung’s 9 September 2026 announcement describes plans to use on-premises AI in semiconductor operations, including defect detection and equipment optimization. It states goals, not a measured yield improvement. Here is our independent, fictional inspection run — NOT Samsung or Mistral performance data. Of 1,000 parts, 20 are defective and 980 are good. A detector catches 90% of defects (18) but also flags 5% of good parts (49). It produces 67 alerts, of which only 18, or 26.9%, correspond to real defects. Two defects are missed; 931 good parts are cleared. The denominator matters: detection rate is 18/20; alert precision is 18/67. Neither alone establishes manufacturing value. A flagged part is not automatically scrapped: review, retesting and process decisions change the economic result. Save three questions for the next factory-AI headline: What is the real defect base rate? How much review and downtime do ...

NVIDIA’s +24% Tokens: Three Gates to Revenue

Image
NVIDIA’s +24% token-throughput case: where is the revenue gate? NVIDIA’s 15 September 2026 post describes Lambda’s DSX MaxLPS test using 19 HGX B200 nodes versus a 16-node baseline within the same power budget. It reports 24% more cluster token throughput. That is a specific company-reported test, not a universal result or a revenue increase. Our separate fictional acceptance test: A generates 1,000,000 tokens and 80% pass a fixed acceptance rule, leaving 800,000 accepted tokens. B generates 1,240,000 and 60% pass that same rule, leaving 744,000. Raw output is 24% higher, while accepted output is 7% lower. These invented acceptance rates are NOT Lambda or NVIDIA measurements. They illustrate why a throughput number alone is insufficient; they do not allege quality deterioration in the reported test. Save three gates before turning an efficiency headline into a stock thesis: 1. Accepted work: same model, quality threshold, latency target and system boundary? 2. Paid demand: how much ...

Microsoft’s AI Sales Case: 20% Higher—Than What?

Image
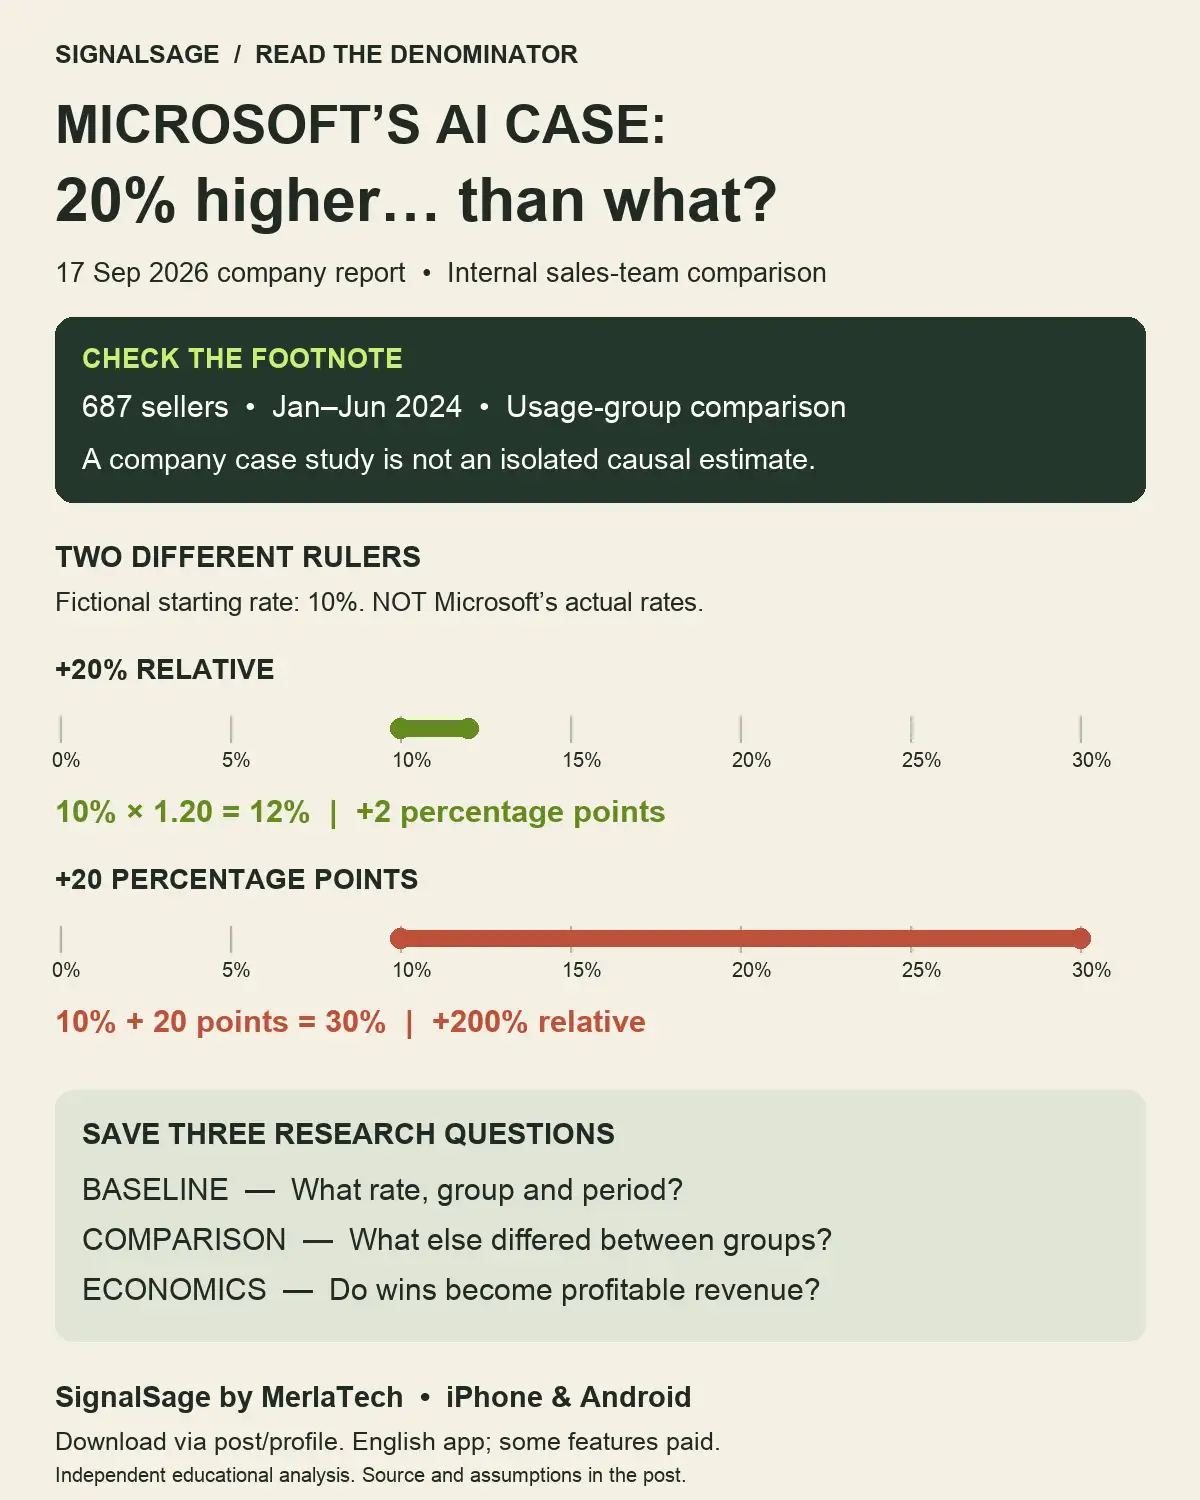
Microsoft’s AI sales case: 20% higher close rates—than what? Microsoft’s 17 September 2026 post reports a sales-team comparison. Its footnote describes internal data on 687 sellers from January–June 2024, comparing regular Copilot users with low-usage sellers. This is a company-reported case, not today’s sales result or an isolated causal estimate of AI’s effect. Our fictional ruler starts at a 10% close rate. A 20% relative increase reaches 12%: a gain of 2 percentage points. Adding 20 percentage points instead reaches 30%, a 200% relative increase. These are teaching examples, NOT Microsoft’s actual rates. Before turning a productivity headline into a stock thesis, save three questions: What is the baseline, population and measurement period? What else differed between the groups? Did additional wins become recognized revenue with attractive margins after software, training and review costs? A useful operational signal still needs a bridge to business economics. Source: https://blogs...

Amazon Leo: More Launch Contracts—What Reaches the Customer?

Image
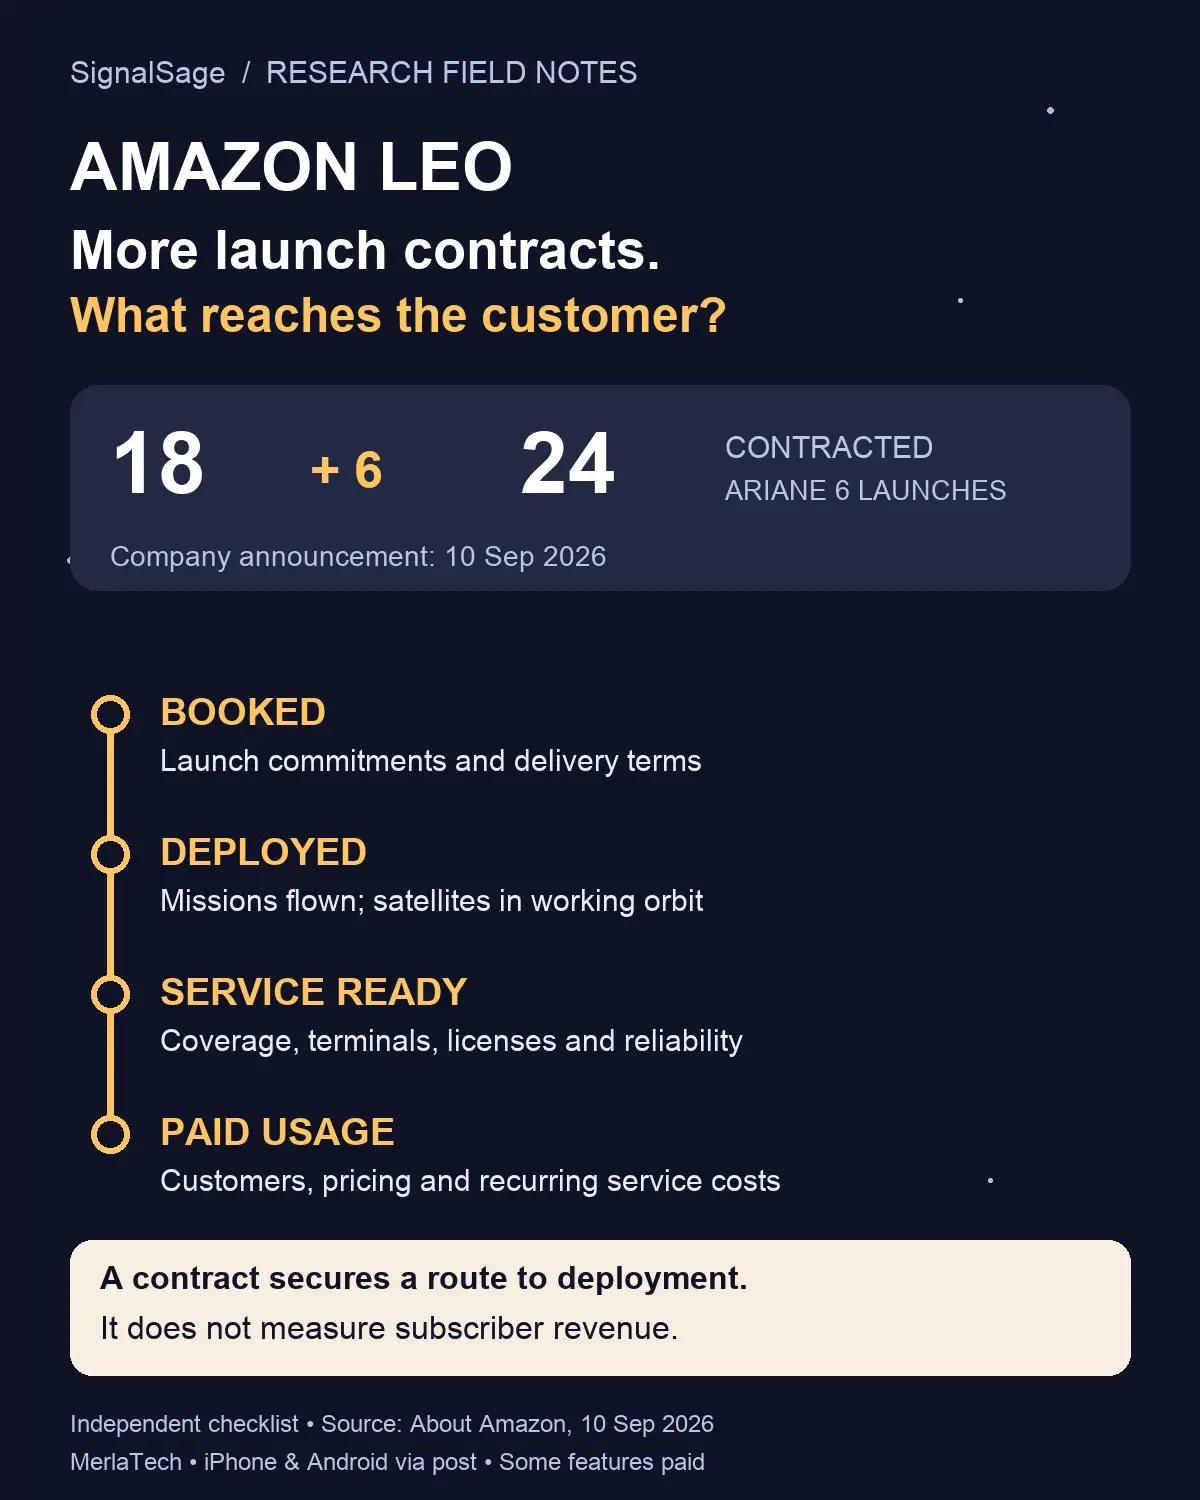
Amazon announced on 10 September 2026 that it was adding six Ariane 6 launch contracts, expanding its Arianespace commitment from 18 to 24 launches. That is a useful fact about contracted capacity. It is not evidence that those six additional missions have already flown, or a measure of subscriber revenue. The announcement is a starting point for a research notebook. To understand the business implications, separate four milestones that are often compressed into a single growth headline: booked, deployed, service ready, and paid usage. 1. Booked: a commitment with conditions A signed launch commitment can secure access to a scarce operational resource. The next questions concern execution: what delivery windows apply, what flexibility exists, and what dependencies could change the schedule? A headline contract count does not disclose all payment terms, cancellation provisions or the allocation of risk between counterparties. Record what the source actually says in one column. Put the u...

Intel + ASML: What Does One Million Wafers Tell Us?

Image
A manufacturing milestone needs a denominator. Intel and ASML’s 7 September 2026 company update says High-NA EUV had processed more than one million wafers across early certification and testing, R&D, and select-layer volume production for a subset of Panther Lake products. This article examines the scope of that statement; it does not independently verify the companies’ results. Schematic research graphic. The wafer grid does not represent the share of testing, R&D or production. What the total can tell you The statement describes accumulated processing activity spanning several purposes. It gives a useful starting point for asking where a technology has been used. Its categories matter: certification work, development work and production work answer different questions. Combining them into one count does not reveal the contribution of each category. Before comparing this figure with another announcement, record the measurement period, system boundary and counting method. Ask...