Posts

Showing posts from October, 2026

Chevron's $14.2B Adjusted Cash Flow: Follow the Cash Boundary.

Image
Two cash-flow figures can describe the same quarter while answering different questions. Chevron's latest earnings release offers a practical research exercise: start with operating cash, subtract capital spending, then identify every extra item before comparing an adjusted total with another company or another period. The dates and the scope Chevron released third-quarter results on October 30, 2026. This note reviews the announcement on November 1 in Beijing. The figures below cover the three months ended September 30, 2026, in millions of U.S. dollars. They are historical quarterly amounts, not annual forecasts or stock-price targets. Start inside the operating boundary Attachment 3 reports net cash provided by operating activities of 16,014. Subtract capital expenditures of 4,011 and the result is free cash flow of 12,003. The summary rounds this to $12.0 billion. Chevron identifies free cash flow as a non-GAAP measure; operating cash flow is the starting reported cash-flow amo...

ExxonMobil Added $888M of Profit. The Segments Moved Opposite Ways.

Image
A rising company profit total can conceal falling businesses underneath it. ExxonMobil’s latest results offer a useful research exercise: reconcile the change across the same segment table before deciding whether improvement was broad or concentrated. The total and the individual businesses answer different questions. Read the dates and comparison first ExxonMobil released third-quarter results on October 30, 2026. This note reviews that announcement on October 31 in Beijing. The quarter ended September 30. The comparison below is third quarter versus second quarter of 2026, not year over year. All amounts are U.S. dollars in millions, using the issuer’s U.S. GAAP earnings table. Start with the company total Total earnings increased from 14,525 to 15,413, a rise of 888. These are earnings, not revenue or cash flow. Keep the measurement label beside the number: a larger earnings total alone does not establish that sales, cash generation and every segment improved together. Open the tota...

Amazon Sales Rose 12%. Prime Day Moved the Comparison.

Image
Amazon's newest earnings release gives investors a useful comparison question: did the business change, or did an event move between quarters? Read the calendar before treating a quarterly growth rate as a clean measure of momentum. The timing disclosure provides context, while the reported result remains the starting point. The news and the period Amazon published its third-quarter results on October 29, 2026. This research note reviews that release on October 30 in Beijing. The financial quarter ended September 30. The announcement date, our review date and the reporting period are three different dates; none should be substituted for another. Start with the reported result Third-quarter net sales were $201.9 billion, up a reported 12% from $180.2 billion a year earlier. Amazon separately reported 13% growth excluding currency effects. Those two percentages use different treatments of exchange rates. Keep the reported and currency-adjusted labels attached whenever you copy either...

20x or 15x? Read the Earnings Behind the P/E

Image
After a stock screen, two P/E numbers can look like a ranking. Before treating the lower one as a bargain, identify the earnings behind each ratio. A short denominator check can explain a difference that the price alone cannot. Save the definition with your research note so you can repeat the comparison later. One fictional stock, two calculations Assume a fictional stock price of $60 and two earnings-per-share figures for the same historical 12 months. For this illustration, both EPS figures use the same diluted-share basis. GAAP EPS is $3; adjusted, non-GAAP EPS is $4. The arithmetic is $60 divided by $3, or 20x, and $60 divided by $4, or 15x. No price change occurred. The lower multiple comes from a different denominator. These invented numbers are not an issuer report, live quote, app calculation or estimate of future results. 1. Freeze the price observation Record the ticker, currency, price and as-of time. If two services use different price observations, that can change the nume...

A Stock Falls From $120 to $60. Check the Share Count First.

Image
A price that moves from $120 to $60 can mean very different things. Before calling it a 50% investment loss, check whether a corporate action changed the unit you are measuring. A stock split changes the share count and the per-share scale; the arithmetic alone does not establish a change in the value of your holding. Start with a clearly labeled example This is a fictional, mechanical two-for-one split illustration in U.S. dollars. It assumes no separate market-price movement, fees or other corporate actions. Before the split, an investor holds 10 shares at $120 each: 10 times $120 equals $1,200. After the split, the investor holds 20 shares at a mechanically adjusted $60 each: 20 times $60 still equals $1,200. The lower per-share number is not, by itself, evidence that half the holding disappeared. Keep ownership beside the price Suppose the fictional company originally has 1,000 shares outstanding. Our investor owns 10 of them, or 1%. Under the same two-for-one split, the company ha...

P&G: Similar Organic Growth, Opposite Volume Signals

Image
 Two segments can report similar organic sales growth while telling different stories about volume. Before turning a sales headline into a research conclusion, separate the outcome from the drivers beneath it. P&G’s latest segment table provides a useful comparison. Read across the same quarter P&G released fiscal 2027 first-quarter results on October 22, 2026, covering July through September 2026. Its detailed table reports Grooming organic sales growth of 4.5%, versus 4.8% for Fabric & Home Care. These are segment figures for the same period, not the companywide growth rate. Organic sales growth is a non-GAAP measure that excludes foreign exchange and acquisition/divestiture effects from the year-over-year comparison. Similar totals, different driver signs For Grooming, the reported volume driver was -0.4%, price was +3.5%, and mix was +1.5%. Fabric & Home Care instead showed volume of +4.3%, price of -0.3%, and mix of +0.8%. The signs matter: the first segment co...

Before Explaining a Stock Move, Align These Three Clocks

Image
A quote, a chart and a company document can sit on one screen while describing different times. Before connecting a price move to a headline, align the quote timestamp, the visible chart window and the document timeline. This short workflow uses actual public MerlaTech web screens captured on October 23, 2026. The interface is labeled SignalAnalytic; it is not a recording of the mobile app. Clock 1: read the quote timestamp Start with the symbol, market and the as-of line beside the quote. In our CNXC page capture, the interface labels the latest available quote October 22, 2026, 16:00 ET and warns that prices may be delayed. That is a record of what the interface displayed, not independent validation of the market price. The day you open the page is not automatically the quote date. Keep the displayed timezone with your note. Clock 2: read the visible chart window Next open Chart and inspect both the selected bar interval and the dates actually visible on the axis. The public view we ...

Price Down 4%, Holding-Period Return Up 2%? Follow the Cash Dividend

Image
A negative price change and a positive holding-period return can describe the same investment. Before comparing a stock chart with a return figure, check whether cash dividends are included. Our fictional one-share ledger shows exactly where the two calculations separate. One share, one holding period Assume you buy one fictional share for $100, receive $6 in cash dividends while holding it, then sell it for $96. There are no other purchases, sales, deposits, withdrawals or corporate actions. Dividends stay in cash and earn no interest. All amounts are US dollars. This is an educational example, not a real company, historical market result, dividend forecast or SignalSage calculation. Keep two numerators visible The price change is $96 minus $100, or -$4. Divide by the original $100 to get -4%. The complete cash ledger instead returns $96 of sale proceeds plus $6 of dividends: $102. Subtract the original $100 and the gross gain is $2. The simple holding-period return is therefore ($96 ...

IBM: A $455M Profit Increase, but Only $67M More Before Tax

Image
An earnings-growth headline can conceal very different changes above and below the tax line. Before treating a higher bottom line as evidence of faster operating growth, build a two-row bridge. IBM's latest quarterly disclosure provides an example that can be checked with ordinary subtraction. Start with the same income measure IBM released Q3 2026 results on October 21, covering the three months ended September 30. Its comparative GAAP table reports income from continuing operations of $2,199 million versus $1,744 million a year earlier. These are continuing-operations figures, not the separate total-net-income row, diluted EPS, or operating non-GAAP earnings. Put the tax provision beside pre-tax income For that same quarter, income from continuing operations before income taxes was $2,497 million versus $2,430 million. The income-tax provision was $298 million versus $686 million. The release reports effective tax rates of 11.9% and 28.2%, respectively. Read all three rows togeth...

After a Stock Screen: Build an Evidence Card Before a Watchlist

Image
A stock can pass a screen without answering the question you actually care about. Save one evidence card for each candidate: the claim, its original source, the relevant date, and evidence that would make you reconsider. This gives your next research session a specific starting point. 1. Turn the filter into a question Write the exact condition that selected the company, including its units and lookback period. Then state what remains unknown. A price-based screen can identify a pattern; it does not establish why a business is improving. Keep the observation separate from the explanation you still need to test. 2. Attach an original source and a clock Investor.gov identifies company disclosures as a resource for investment due diligence and links to EDGAR and guides to reading filings. For a business claim, record the filing or company release, its publication date, and the period it covers. A recently published article can still describe an older quarter. A chart has its own interval ...

NVIDIA: Why GAAP EPS Was Higher Than Non-GAAP EPS

Image
An adjusted earnings number does not have to be the larger number. For a stock researcher, the useful question is which items were removed, in which direction, and on what tax basis. NVIDIA offers a historical example that turns this question into a reproducible worksheet rather than a judgment about which headline looks stronger. Lock the quarter and denominator The August 26, 2026 release covers Q2 fiscal 2027, ended July 26, 2026. Diluted EPS was $2.46 GAAP and $2.22 non-GAAP. The 10-Q confirms GAAP net income of $59,688 million and 24,285 million diluted weighted-average shares. Fiscal 2027 here is a fiscal-year label, not a calendar-2027 reporting period. Read the signed reconciliation In the release's Q2 reconciliation, net income moves from $59,688M through a negative $7,251M total pre-tax adjustment and a positive $1,517M income-tax adjustment to $53,954M non-GAAP. Its equity-securities-gains line removes $7,771M; other adjustment lines also matter. Beginning in Q1 FY27, NV...

P&G: Sales Rose 2%, Organic Growth Was Flat. Three Checks for October 22

Image
A sales-growth headline is a starting point for research, not a complete account of demand. Before P&G's next earnings discussion, build a small comparison sheet that keeps the reporting basis, period and operating drivers together. That makes the next release easier to read without treating a change in presentation as a change in customer activity. The calendar comes first P&G's September 24 announcement schedules its fiscal 2027 first-quarter earnings discussion for October 22, 2026, at 8:30 a.m. ET. The baseline below comes from the July 29 release covering fiscal Q4, April–June 2026. These are historical figures, not the forthcoming quarter's results. 1. Compare the same measurement basis For that Q4, reported net sales grew 2% year over year while organic sales were unchanged. Organic sales growth is non-GAAP: it excludes foreign exchange and acquisition/divestiture effects. The release says foreign exchange and rounding each contributed one percentage point ...

Bank of America's $161M FTE Adjustment Is Not Extra Cash

Image
Watch the original 67-second SignalSage research video on YouTube . A bank can publish two net-interest-income figures for the same quarter without collecting the difference as extra cash. Bank of America's third-quarter release offers a useful research check: use the exact tables and the tax-equivalent footnote together, rather than subtracting rounded headline numbers. Start with the reporting basis The results released October 14, 2026 cover the quarter ended September 30. Page 14 of the official release reports net interest income of $16,449 million. Page 18 presents $16,610 million on a fully taxable-equivalent, or FTE, basis. The table's footnote explicitly labels FTE a non-GAAP measure. Both are consolidated Bank of America amounts for the same quarter; this is not a comparison between two business segments. Rebuild the adjustment The exact bridge is $16,449M + $161M = $16,610M. The $161 million is independently disclosed in Endnote A and the page 18 footnote, so it is ...

TSMC's 8% 2nm and 68% HPC: Two Mix Tables, No Joint Revenue Share

Image
Two large percentages can produce a precise-looking answer that the evidence does not support. For a US investor reading TSMC's latest quarter, the useful question is which revenue population each percentage measures, and whether the filing connects the two categories. The two reported lenses TSMC's October 15, 2026 management report covers Q3, the quarter ended September 30. Its technology table reports 2-nanometer at 8% of wafer revenue. Its platform table reports high-performance computing, or HPC, at 68% of net revenue. The first classifies manufacturing technology; the second classifies end-market platforms. Keep both table headings attached to the numbers. Why the tempting calculation fails Multiplying 0.08 by 0.68 gives 0.0544, or 5.44%. That is our arithmetic, not a company-reported revenue share. The inputs use different stated denominators, so they first need a common revenue scope. Even with a common denominator, two separate category shares do not identify their...

JPMorgan CIB: Why $663M of Credit Cost Wasn't $663M of Charge-offs

Image
A bank's credit-cost headline is easier to interpret when its components stay visible. JPMorganChase's latest Commercial & Investment Bank results provide a precise example: the segment's credit provision fell from a year earlier while its net reserve build increased. Treating the whole provision as this quarter's net charge-offs would erase that distinction. One segment, one reported quarter The October 13, 2026 earnings release covers the third quarter ended September 30. In the Commercial & Investment Bank, or CIB, the provision for credit losses was $663 million. These are CIB segment amounts, not JPMorganChase's firmwide total and not the consumer credit-card business. The release separately reports firmwide credit costs, so the scope label matters. Read the two components For CIB, the company reports $211 million of net charge-offs and a $452 million net reserve build. The disclosed amounts add exactly to the $663 million provision: 211 + 452 = 663...

ASML Raised Its 2026 Sales Floor. The EUR45B Ceiling Stayed Put.

Image
A raised sales outlook can describe several different changes. For ASML stock research, comparing both endpoints shows exactly what moved: the company's October 14 update increased its 2026 sales floor while leaving the ceiling unchanged. That is more precise than treating the entire range as an equal upward shift. Two dated forecasts for the same year ASML's July 15, 2026 Q2 release put full-year 2026 total net sales at EUR43-45 billion. The October 14 Q3 release changed that outlook to EUR44-45 billion. Both ranges refer to full-year 2026 sales in euros; they are dated management forecasts, not two quarters of reported revenue. What the endpoints tell you Our arithmetic on those disclosed ranges gives a EUR1 billion increase at the lower endpoint and no change at the upper endpoint. The simple midpoint moves from EUR44 billion to EUR44.5 billion, a EUR0.5 billion increase. This midpoint is our calculation, not an extra point forecast supplied by ASML. A higher floor and an...

Alphabet: $39.1B of Operating Cash, Yet Negative Free Cash Flow. Why?

Image
For US stock research, the sign of one cash metric needs a definition. Alphabet's Q2 2026 provides a useful historical example: it generated positive cash from operations while reporting negative free cash flow. Reading the reconciliation explains that combination and gives you a better question to ask about investment spending. These are June-quarter results announced July 22, 2026, revisited for this October research video; they are not October operating results. Watch the original research video Watch the 89-second original SignalSage animation One quarter, three exact amounts Alphabet's release presents a current-quarter reconciliation in millions of US dollars. For Q2 2026, net cash provided by operating activities was 39,069. Purchases of property and equipment were 44,924. The company defines its non-GAAP free cash flow as operating cash flow less capital expenditures. Keeping that single quarter and definition intact gives 39,069 minus 44,924 equals negative 5,855 milli...

NIKE Inventory: Down 3% Year Over Year, Up $345M Since May

Image
 NIKE's inventory headline and its quarterly balance sheet can point in opposite directions without contradicting each other. The useful research question is which earlier date each comparison uses. One ending balance, two comparison bases The October 1, 2026 fiscal Q1 release covers the quarter ended August 31, 2026. It reports inventories of about $7.8 billion, down 3% year over year. The October 2 Form 10-Q compares August 31 with May 31, 2026: $7,846 million versus $7,501 million. Rebuild the sequential change Our arithmetic on the filed USD-million values: 7,846 - 7,501 = 345; 345 / 7,501 = approximately 4.60%. NIKE describes this as a rounded 5% sequential increase. The prior-year decrease and the sequential increase use different starting dates. A balance change is not the cash-flow line The same 10-Q shows a negative $312 million inventory adjustment in the three-month operating cash-flow reconciliation. It is not the same figure as the $345 million balance-sheet increase. ...

Microsoft's $678B RPO: 30% Is a Timing Clue, Not Total Revenue

Image
For stock research, a large contract balance is useful only when you know what is inside it and when the work becomes revenue. Microsoft provides a concrete example. This October 12 research note revisits its July 29, 2026 disclosure for the quarter ended June 30. The balance and management's timing estimate belong together; neither is a fresh October sales result. Two labels before the headline Microsoft's investor metrics identify commercial remaining performance obligation, or RPO, as revenue allocated to commercial obligations still to be performed. The definition includes unearned revenue and contracted amounts that will be invoiced and recognized in future periods. The Q4 table shows $678 billion. This is a commercial contract-related balance, not the revenue earned in one quarter, cash already collected, or a profit figure. The recognition horizon On the July 29 call, management described a 2.3-year weighted average duration for RPO including OpenAI and said roughly 30%...

Apple repurchased 401.7M shares. Its share count fell by 343.5M.

Image
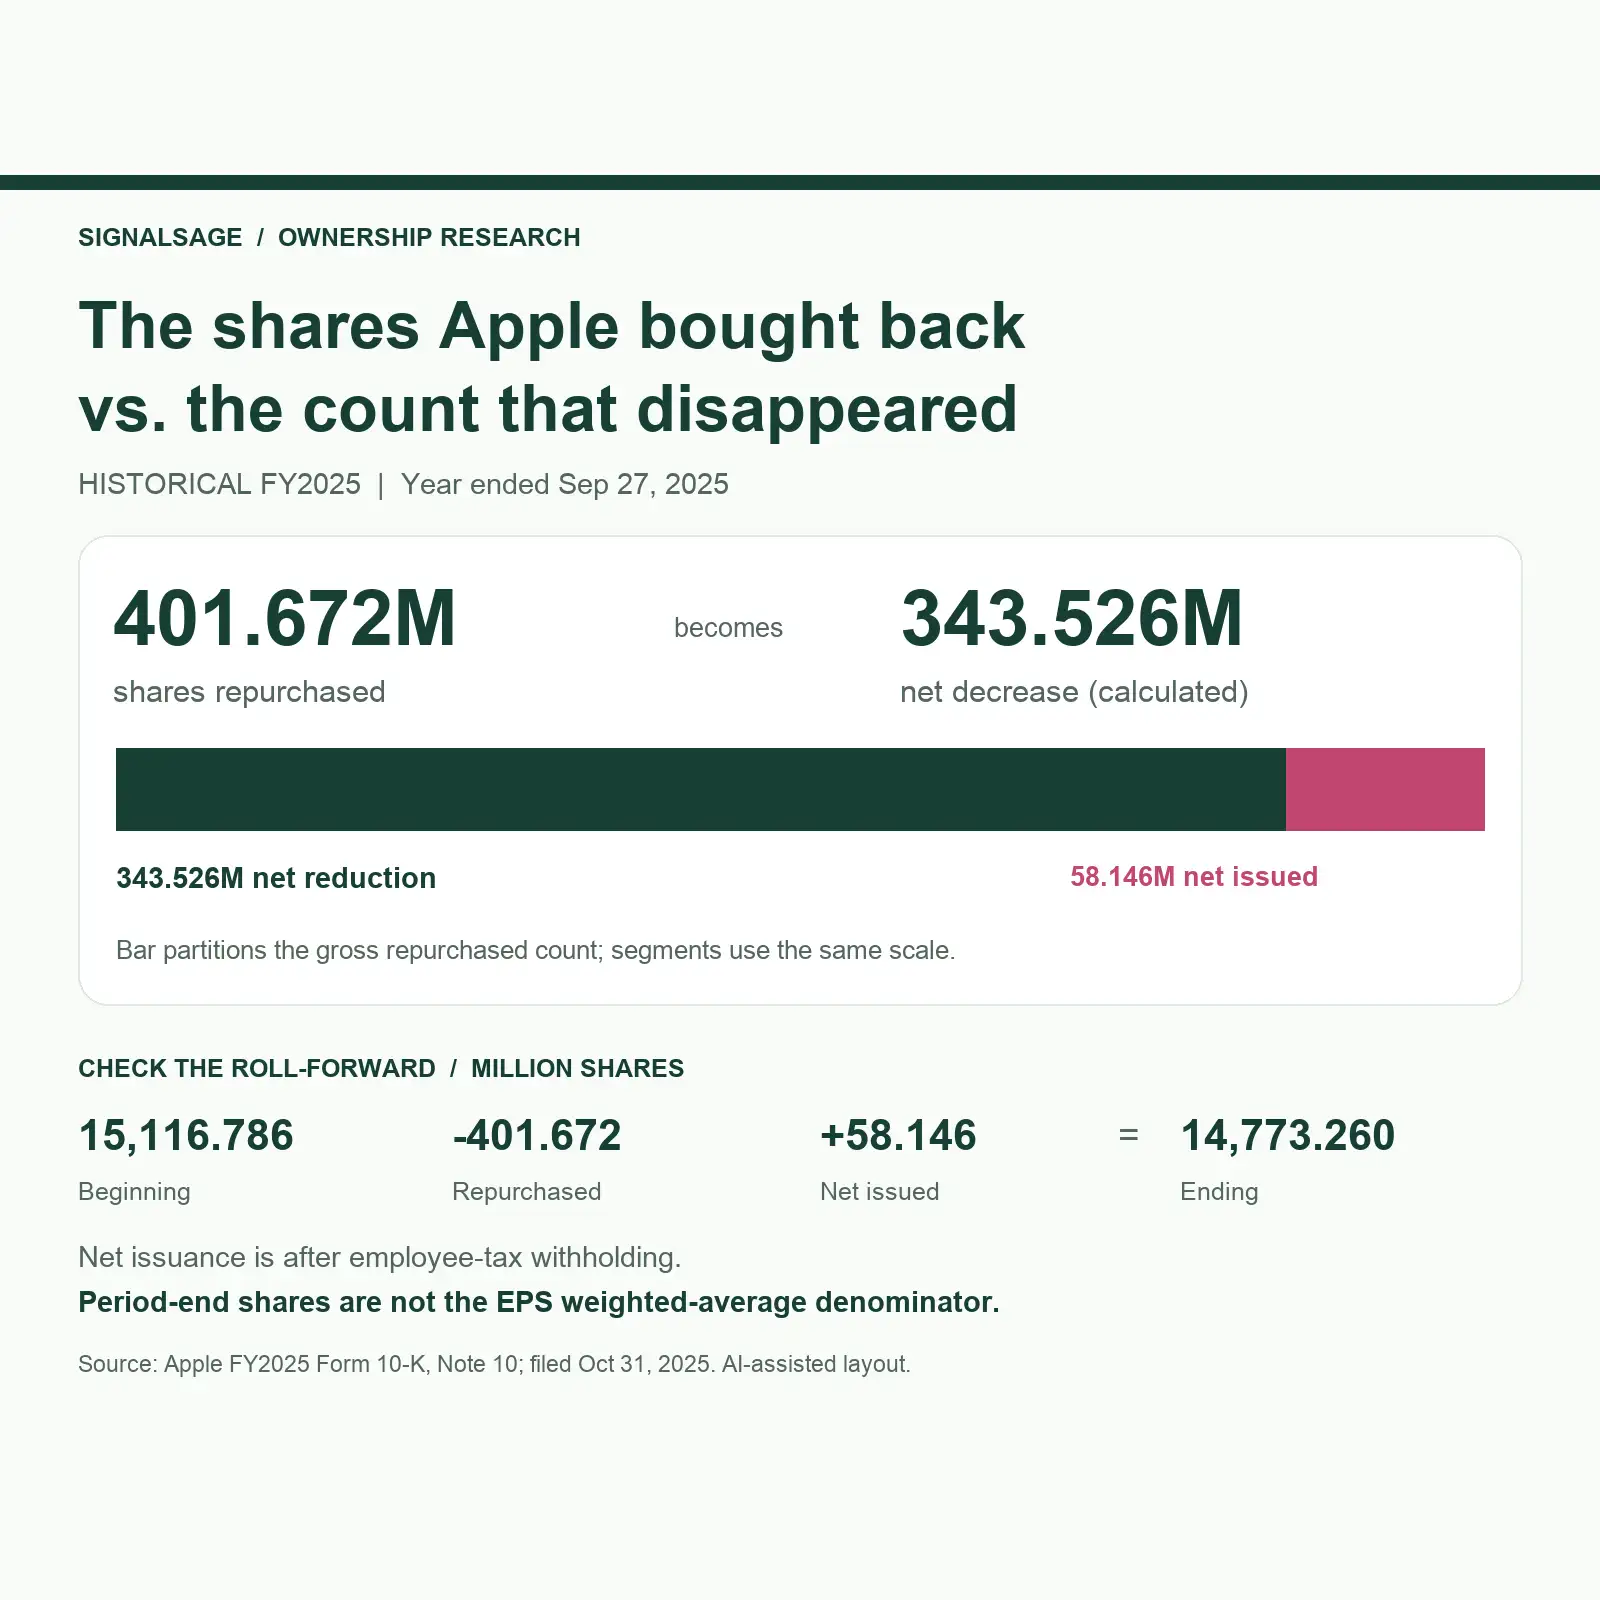
A buyback headline tells you how many shares a company acquired. To study the ownership denominator, also reconcile the shares that entered circulation. Apple's FY2025 filing provides a clean historical example: gross repurchases exceeded the net decline in outstanding shares. That gap is useful evidence, rather than a verdict about whether the stock was cheap. Historical evidence, with dates attached This case covers the fiscal year ended September 27, 2025. Apple filed the Form 10-K on October 31, 2025. It is a historical research exercise, not a new FY2026 announcement. Note 10 presents its share roll-forward in thousands; the figures below convert that table to millions. Reconcile the count Beginning shares of 15,116.786 million, less 401.672 million repurchased, plus 58.146 million issued net of employee-tax withholding, equal 14,773.260 million ending shares. Our subtraction gives a net decrease of 343.526 million. The filing separately describes approximately 402 millio...

TSMC: NT$1.494T Is Not Yet a Reported US-Dollar Quarter

Image
A quarter can be assembled before every quarterly result is released. The useful research step is to label what is reported, what you calculated, and what remains unknown. TSMC is a timely example: its September revenue announcement is dated October 8, while its third-quarter earnings conference is scheduled for October 15. These are two different information stages. Three reported months, one calculated sum TSMC lists July, August and September 2026 consolidated revenue as NT$467,580 million, NT$514,806 million and NT$511,857 million. Adding the three reported monthly amounts gives NT$1,494,243 million, or NT$1.494243 trillion, for July through September. This sum is our arithmetic from company disclosures, not a separately quoted US-dollar quarterly result. TSMC labels the 2026 monthly figures unaudited. The tempting currency shortcut The July 16 earnings release guided third-quarter revenue to US$44.6–45.8 billion. It also used an assumption of US$1 = NT$32 for its margin outlook. D...